A control chart for s shown below. Determine whether the process mean is within statistical control. If it is
not, identify which of the three out-of-control criteria lead to rejection of a statistically stable mean. 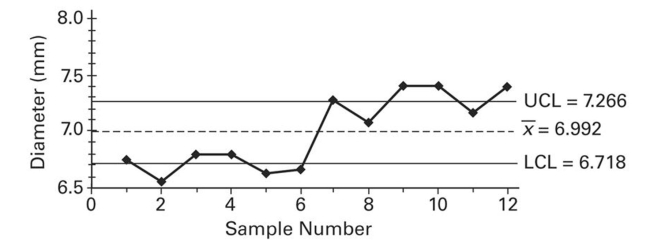
Definitions:
Relative Risk
A measure in epidemiology that compares the risk of a health event among one group with the risk among another group.
Sample Proportion
A statistical measure that represents the proportion of success or a particular attribute in a sample.
Confidence Interval
A range of values, derived from sample statistics, that is likely to contain the value of an unknown population parameter, giving an estimate of the uncertainty around the main measurement.
Population Proportions
Ratios or fractions that represent parts of a whole for specified groups within a population.
Q1: Which statement is not true for goodness-of-fit
Q9: Describe an R chart and give an
Q26: The following table gives the US domestic
Q38: Use a 0.05 level of significance
Q54: Given below are the analysis of
Q88: A manager records the production output of
Q115: A parcel delivery service lowered its prices
Q151: Find the value of the linear
Q172: Of ten adults, at least one of
Q188: The probability of getting at least two