Following is a time series graph for monthly closing price for the Dow Jones Industrial Average (beginning March 2003) . Which of the following statements is true? 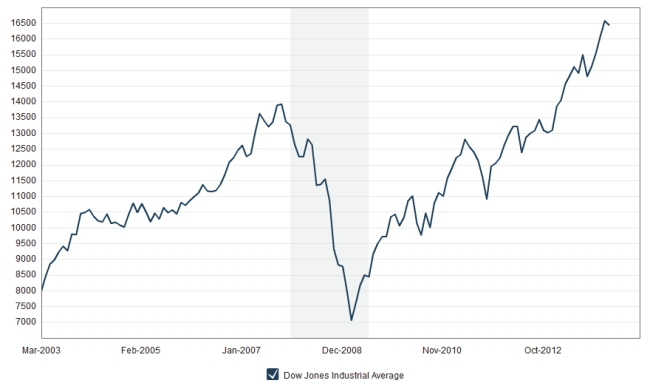
Definitions:
Overbooked Customers
A situation in service industries where more reservations or bookings are accepted than there is capacity for, leading to potential inability to serve all customers.
Customer Arrivals
Refers to the occurrence of customers appearing or entering a space, such as a store or website, over a period of time, critical in demand forecasting and operations management.
Customer Arrivals
The rate or pattern at which customers enter a service area, store, or website, crucial for demand forecasting and resource planning.
Q6: A mid-priced chain of hotels, Hometown Suites,
Q9: The following table shows data on
Q11: A regional survey was carried out to
Q17: Grandma Gertrude's Chocolates, a family owned business,
Q20: A recent survey of local cell phone
Q22: A manufacturer of cordless electric shavers sampled
Q22: Suppose the correlation, r, between two variables
Q24: The following tables display some of the
Q47: Shown below is a correlation table showing
Q79: Estimate the linear regression model that relates