Following is a time series graph for monthly closing price for the Dow Jones
Industrial Average (beginning March 2003). 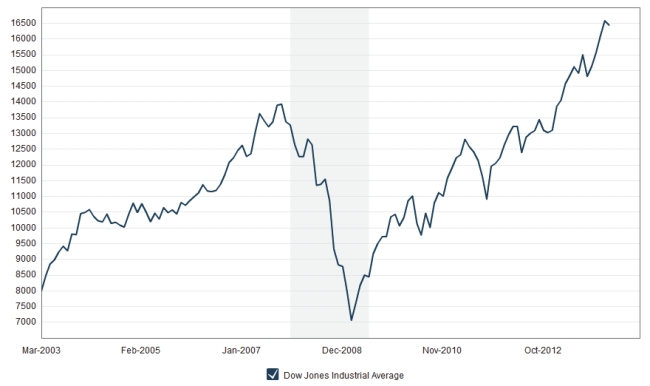
A. Are the closing prices for the Dow Jones Average from October 2004 through
December 2006 fairly stationary? Explain.
b. What was the most volatile period of time for the Dow Jones average? Explain.
c. Would a histogram provide a good summary of these stock prices? Explain.
Definitions:
Confounding
A situation in statistical analysis where the effect of one variable on another is distorted by a third variable.
Confounded
A situation in research where the effect of one variable cannot be separated from the effect of another, affecting the validity of conclusions.
Packaging Information
Refers to the details and data provided on the packaging of products, highlighting content, usage, and safety information.
Appearance
The way that something or someone looks, which can include aspects of design, presentation, or physical manifestation.
Q7: It is estimated that 20% of luxury
Q9: One division of a large defense contractor
Q10: Consider the following side by side bar
Q10: In a metal fabrication process, metal rods
Q11: A small business ships specialty homemade candies
Q21: A consumer group was interested in comparing
Q26: What percentage of the variability in sales
Q58: Boxplots of earnings per share (EPS) data
Q60: EU (European Union) countries report that 46%
Q68: Before being released to market, a drug