Multiple Choice
Listed below is the net sales in $ million for Home Depot Inc., and its subsidiaries from 1994 to
2003. 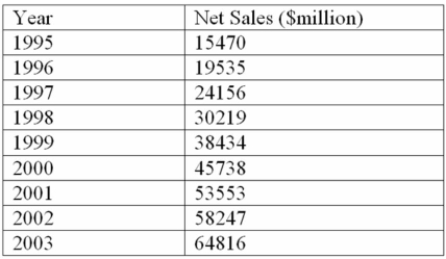
Using the printout below, what are the estimated sales for 2009? 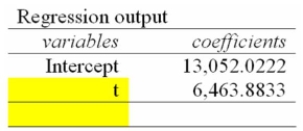
Definitions:
Related Questions
Q7: (i. Bar charts are useful for showing
Q26: (i. A company has warehouses in four
Q58: Considering the chart below, what is the
Q73: Given the following decision table in which
Q94: i. If the coefficient of correlation is
Q102: At a recent car show, a sample
Q110: A survey of the opinions of property
Q114: The weights (in grams) of the contents
Q125: The information below is from the multiple
Q128: A research analyst wants to compare the