Use the scatter diagrams to verify which statements are correct:
Chart A 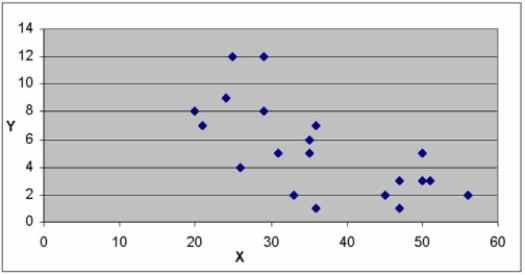
Chart B 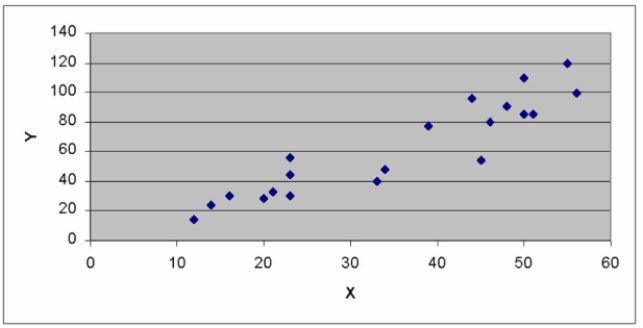
Chart C 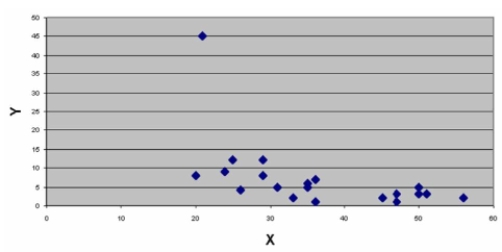
Definitions:
Units Sold
The total number of product units that have been sold during a specific time period.
Cost Formula
A method or equation used to calculate the total cost of production, including fixed and variable expenses.
Activity Level
Refers to the volume of production or the rate of operations within a specific period.
Costs Incurred
Expenses that a company has recognized or realized, typically related to the operations, production, or projects undertaken.
Q8: i. Multiple regression analysis examines the relationship
Q46: The following table lists the average price
Q48: Which one of the following is not
Q66: i. The number of degrees of freedom
Q67: A local retail business wishes to determine
Q67: i. The CPI serves only one major
Q72: Which of the following statements is correct?<br>A)
Q105: A sample of General Mills employees was
Q123: A logarithmic straight-line trend equation should be
Q139: A scatter diagram is a chart,<br>A) in