The annual dividend rates for a random sample of 16 companies in three different industries,
Utilities, banking, and insurance were recorded. The ANOVA comparing the mean annual dividend
Rate among three industries rejected the null hypothesis that the dividend rates were equal. The
Mean Square Error (MSE) was 3.36. The following table summarized the results: 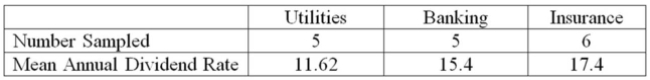
Compare the mean annual dividend rate for companies in the utilities and insurance industries and
Construct the 95% confidence interval.
Definitions:
Treatment Sum
The total sum of all the values of the outcome variable for a specific treatment level in an experimental design.
Squared Deviations
The squares of the differences between each data point in a data set and the mean of that data set, used in various statistical calculations.
Grand Mean
The grand mean is the mean of means, calculated by taking the average of the mean values from multiple groups or samples within the data.
Population Variances
A measure that indicates the degree to which individuals in a population vary or differ from the mean of the population.
Q11: Two accounting professors decided to compare the
Q15: The branch of statistics from which we
Q19: A sample of General Mills employees was
Q25: Phillips Corporation purchased 1,000,000 shares of Martin
Q42: A common- size analysis of the balance
Q69: A sales manager for an advertising agency
Q71: Allen Corporation accounts for its investment in
Q102: An F statistic is:<br>A) a ratio of
Q102: From a creditor's point of view, the
Q111: Compared to an identical company that uses