The following graph shows the marginal cost (MC) and marginal benefit (MB) of holding real money balances. The market is initially in equilibrium at £100. Refer to the graph to answer the question. 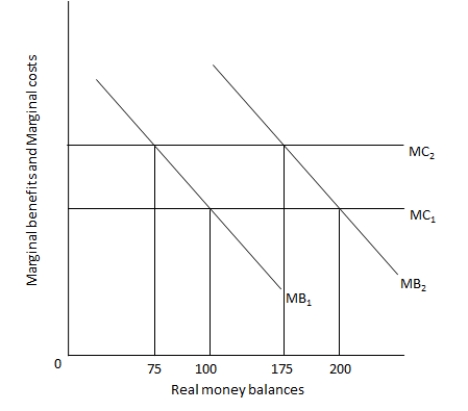 Suppose there is an increase in real incomes. Other things remaining the same, which of the following is true?
Definitions:
Q5: Moral hazard occurs when someone changes their
Q10: A trade surplus would mean that the
Q15: The marginal propensity to save (MPS) in
Q31: Which of the following is an example
Q42: What are the various ?nancial ?ows in
Q73: Africa is a leading of source of
Q81: According to Solow's model, economic growth will
Q83: The correct policy response for aligning the
Q86: The equilibrium price level in the economy
Q90: How does privatization help improve economic e?ciency?