The following graph shows the bid value and probability of winning an auction for an oil painting under a first-price sealed bid auction with private values. The bidder is willing to pay a maximum of £2000 for the oil painting. Refer to the graph to answer the question. 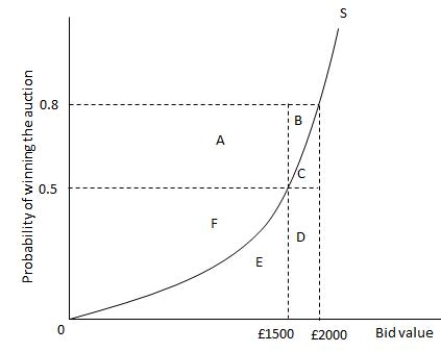 The expected value from winning the auction at the price of £2000 is equal to the area _____.
Definitions:
Debt To Suppliers
Liabilities owed to suppliers from transactions where goods or services were purchased on credit.
Showroom Expansion
involves the physical growth or enhancement of a retail space used to display products for sale, intended to increase customer engagement and sales.
After-Tax Maintenance Cost
The expense associated with maintaining an asset or investment after accounting for the effects of income taxes.
Maintenance Cost
Expenses incurred to keep an asset in operational condition or restore it to its operational condition.
Q22: After the financial crisis of 2007-08, cash
Q46: A firm follows a cost leadership strategy
Q54: When a firm's learning curve is flat,
Q57: The following graph shows a downward-sloping demand
Q58: Low interest rates in the economy lead
Q62: The heavy discounts offered by budget airlines
Q70: If profits in the textile industry fall,
Q82: Assume that wages in an economy do
Q91: In a perfectly competitive market, resources are
Q100: An advertising campaign for a good that