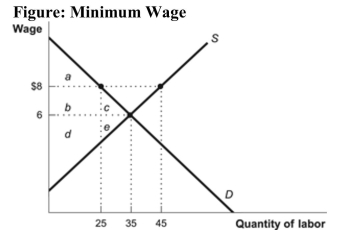
 Reference: Ref 8-13 (Figure: Minimum Wage) Refer to the figure. How many workers are unemployed at a minimum wage of $8?
Definitions:
Supply Curve
A graph that shows the relationship between the price of a good and the quantity of the good that producers are willing to sell at various prices.
Demand Curve
A visual diagram illustrating the connection between a product's price and the amount consumers are willing to purchase.
Motorcycle Manufacturers
Companies that design, produce, and market motorcycles and potentially other motorized two-wheeled vehicles.
Equilibrium Quantity
The quantity of goods or services that is supplied and demanded at the equilibrium price, where demand and supply are balanced.
Q1: <img src="https://d2lvgg3v3hfg70.cloudfront.net/TB3375/.jpg" alt=" Reference: Ref 9-4
Q8: What is the standard of care used
Q9: How does the law protect trademarks, trade
Q22: A tax on sellers of popcorn will:<br>A)
Q45: (Figure: Market Activity with and without Trade)
Q49: Which of the following scenarios would cause
Q68: A tariff is a:<br>A) tax on imports.<br>B)
Q91: The key condition for equilibrium to occur
Q125: If the price of ice cream changes
Q148: A ―buy low, sell high‖ strategy allows