Figure: Dynamic Aggregate Demand 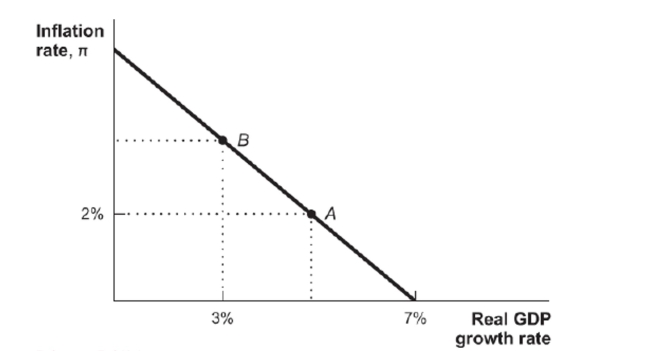 Reference: Ref 13-1 (Figure: Dynamic Aggregate Demand) Point B on this dynamic aggregate demand curve represents an inflation rate of
Definitions:
Aggregate Supply
The total supply of goods and services that firms in an economy are willing to sell at a given overall price level, across all existing price levels.
Long-run Aggregate Supply
The total supply of goods and services that an economy can produce when resources are fully employed at their most efficient levels, without inflation.
Short-run Aggregate Supply
The total supply of goods and services that firms in an economy are willing to produce at a given overall price level in a specific time period.
Aggregate Quantity Demanded
The aggregate quantity of a product or service that buyers are prepared and capable of buying at a specific price point within a certain time frame.
Q3: Why does the irreversible nature of some
Q12: The money multiplier equals<br>A) the amount of
Q49: (Table: National Banks) Assume that all banks
Q59: <img src="https://d2lvgg3v3hfg70.cloudfront.net/TB3375/.jpg" alt=" For a family
Q60: The Federal Reserve has direct control over<br>A)
Q78: People engage in intertemporal substitution because they<br>A)
Q97: All of the following are examples of
Q100: If the velocity of money and real
Q130: Future Social Security recipients with similar life
Q130: Bubbles in asset markets are usually easy