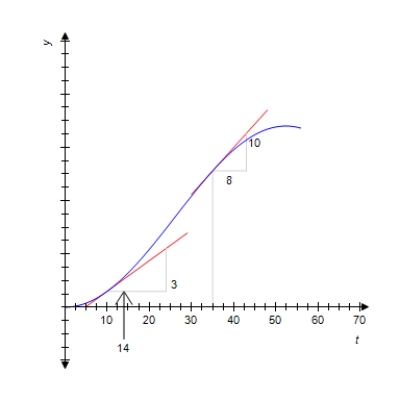
The graph shows the volume of wood produced in a single-species forest. Here f(t) is measured in cubic meters/hectare and t is measured in years. By computing the slopes of the respective tangent lines, estimate the rate at which the wood grown is changing at the beginning of year 10 and at the beginning of year 35.
Definitions:
Convenience Sample
A non-random sample selected because of its accessibility and ease of inclusion in the study, not representing the whole population accurately.
Judgment Sample
A sampling technique where the samples are selected based on the judgment of the researcher, rather than random selection.
Random Sample
A subset of a statistical population in which each member has an equal chance of being chosen, used to make inferences about the whole population.
Correlation
A metric that shows how much two or more variables move in relation to each other.
Q16: You are given the graph of a
Q67: A furniture store offers free setup and
Q75: A certain species of turtle faces extinction
Q81: Find the real roots of the equation
Q124: Find an equation of the line that
Q162: Find function f such that <img src="https://d2lvgg3v3hfg70.cloudfront.net/TB8255/.jpg"
Q182: Find the third derivative of the function.
Q220: Productivity and yield of cultivated crops are
Q237: Find the first and second derivatives of
Q248: Find the differential of the function.