Multiple Choice
The figure shows the graph of vx versus time for an object moving along the x-axis. Solve graphically for the distance traveled from t = 9.0 s to t = 13.0 s. 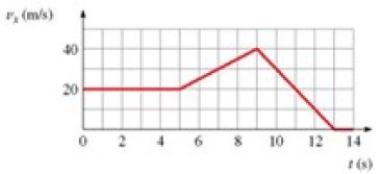
Definitions:
Related Questions
Q12: A 4.00 kg mass is moving in
Q24: The problem of asymmetric information is absent
Q29: An object starts from rest and travels
Q45: The best way to learn problem-solving techniques
Q53: Find the equation v<sup>2</sup> = ah +
Q53: If monitoring by a principal is imperfect,
Q61: 1.0 micrometer equals how many millimeters?<br>A) 1.0
Q65: A 2.00 kg pendulum bob on a
Q81: Interaction partners<br>A) are equal in magnitude and
Q85: Amy purchases only coffee and croissants. If