Graph 17-3 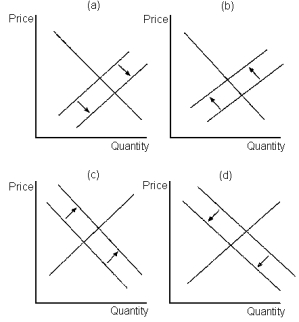 Lines in these figures reflect the potential effect of entry and exit in a monopolistically competitive market on the demand and/or marginal cost curves of incumbent firms.
-Refer to Graph 17-3.Panel c in the set of graphs shown depicts the effect on incumbent firms of:
Definitions:
Output
The total amount of goods or services produced by a business, industry, or economy.
Marginal Revenue
Additional earnings received from the sale of one more unit of a product or service.
Marginal Cost
The financial commitment for manufacturing an additional unit of a product or service.
Profits
The financial gain obtained when the revenues earned from business activities exceed the expenses, costs, and taxes needed to sustain those activities.
Q6: The exit of existing firms from a
Q16: Refer to Graph 14-2. When price rises
Q26: Refer to Graph 17-2. Which of the
Q54: In a competitive market, the price line
Q69: Refer to Graph 15-3. A profit-maximising monopoly
Q81: When a firm decides to retain its
Q89: When a firm operates under conditions of
Q95: When new entrants to a competitive market
Q115: A comparable worth law is likely to:<br>A)
Q133: Refer to Graph 14-1. When market price