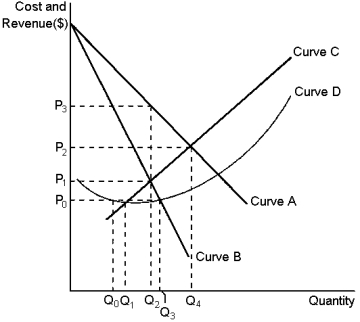
Graph 15-2  This graph reflects the cost and revenue structure for a monopoly firm.Use the graph to answer the following question(s) .
-Refer to Graph 15-2.The demand curve for a monopoly firm is depicted by curve:
Definitions:
Advertising Expenditure
The amount of money spent on promoting products or services through various media and marketing channels.
Marginal Cost of Production
The cost of producing an additional unit of a good, taking into account both variable and fixed costs.
Price Elasticity of Demand
A measure of how much the quantity demanded of a good responds to a change in the price of that good, with elasticity greater than 1 indicating a high responsiveness.
Marginal Cost
The increase in cost resulting from the production of one additional unit of output.
Q40: The argument that consumers will not be
Q59: Advertising will be more common in markets
Q75: If a firm in a competitive market
Q76: Tax schemes that satisfy the benefits principle
Q89: Refer to Table 16-5. If both firms
Q110: Refer to Table 16-1. Assume that there
Q111: Raising the living standards of the poor
Q114: Arbitrage is the process by which:<br>A) a
Q131: Refer to Graph 17-3. Panel d in
Q136: Variable costs change as the firm alters