Graph 15-2
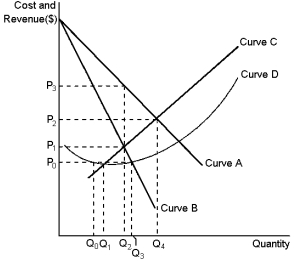 This graph reflects the cost and revenue structure for a monopoly firm. Use the graph to answer the following question(s) .
-Refer to Graph 15-2. The number of consumers who did not buy the good despite a willingness-to-pay greater than marginal cost is given by:
Definitions:
Equipment
Tangible, long-term assets used in the operation of a business to produce goods or provide services, usually subject to depreciation over their useful lives.
Cash Flow
The net amount of cash and cash-equivalents being transferred into and out of a business.
Operating Activities
Activities that relate to the primary, day-to-day operations of a business, such as selling products or providing services.
Prepaid Expenses
Assets on the balance sheet representing services or goods paid for upfront but not yet consumed.
Q25: Refer to Graph 13-2. The changing slope
Q31: The short run is defined as the
Q44: Bob Edwards owns Bob's Bagels. He hires
Q46: During the 1990s, the members of OPEC
Q67: Refer to Table 13-3. What is the
Q85: If tax laws become simplified then:<br>A) the
Q111: Marginal cost equals:<br>A) total cost divided by
Q111: When advertising is used to strengthen brand
Q112: If a firm with increasing marginal costs
Q131: Refer to Graph 13-4. This firm experiences