Graph 14-1
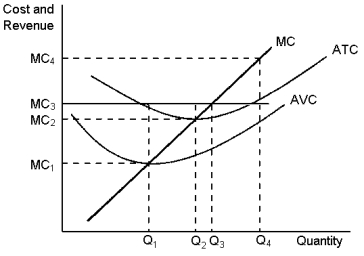
This graph depicts the cost structure for a firm in a competitive market. Use the graph to answer the following question(s) .
-Refer to Graph 14-1. When market price is at MC4, a profit-maximising firm will produce what level of output?
Definitions:
New Firms
Newly established business entities that often bring innovation, competition, and dynamism to their respective markets.
Long-Run Equilibrium
A state in which all factors of production and prices adjust fully to economic changes, with all markets clearing and no external pressures affecting supply and demand.
Efficient Scale
The quantity of output that minimizes average total cost.
Perfectly Competitive
A market structure characterized by a large number of small firms, homogenous products, and free entry and exit.
Q14: The amount of money that an orchardist
Q17: Sunk costs are relevant to decisions about
Q22: A firm in a monopolistically competitive market
Q33: Describe how government is involved in creating
Q45: In Australia, crocodiles are farmed for their
Q64: When a new firm enters a monopolistically
Q68: Specialisation among workers occurs when:<br>A) each worker
Q93: There is little disagreement among people about
Q119: Refer to Graph 15-2. The marginal-cost curve
Q146: When marginal revenue equals marginal cost:<br>A) the