Multiple Choice
Graph 13-3
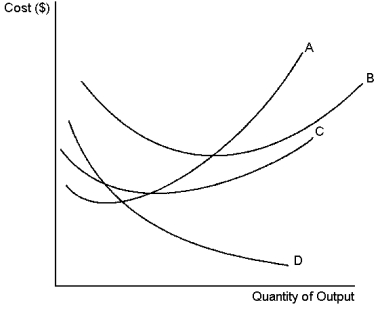 The set of curves above reflect information about the cost structure of a firm. Use this graph to answer the following question(s) .
-Refer to Graph 13-3. Which of the curves is most likely to represent marginal cost?
Definitions:
Related Questions
Q9: Indonesia and Australia engage in international trade
Q16: Refer to Graph 15-5. Which of the
Q17: A Pigovian tax:<br>A) allocates pollution to those
Q41: Suppose people plant flowering trees near their
Q42: Discount coupons have the ability to help
Q92: A consortium of government, local councils, farmers
Q108: The entry and exit decisions of firms
Q115: The amount of money that a firm
Q144: When the social cost of an externality
Q146: When marginal revenue equals marginal cost:<br>A) the