Multiple Choice
Graph 13-4
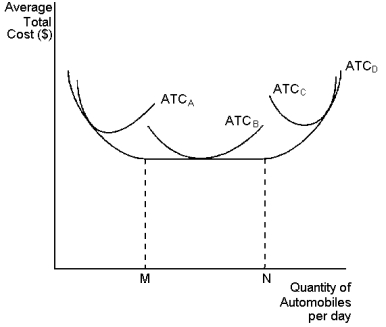 This graph depicts average total cost functions for a firm that produces automobiles. Use the graph to answer the following question(s) .
-Refer to Graph 13-4. At levels of output below point M, the firm experiences:
Definitions:
Related Questions
Q30: Why are tradeable pollution permits considered to
Q42: A positive production externality will cause a
Q50: In the long run, the output of
Q56: Why do governments tend to run programs
Q69: A 'tax liability' refers to:<br>A) the fine
Q75: The average tax rate measures the:<br>A) fraction
Q96: Consider the following diagram of a monopoly.<br>
Q109: Why does society tend to produce too
Q122: During the summer Jeremy, a small business
Q137: One example of price discrimination occurs in