Graph 9-11
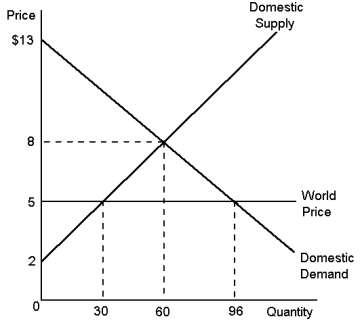
-Using Graph 9-11, assume that the government imposes an import quota of 20 hammers. Answer the following questions, given this information.
a. What is the equilibrium price and quantity of hammers after the quota is imposed?
b. What is the quantity of hammers imported before the quota?
c. What is the quantity of hammers imported after the quota?
d. What is the amount of consumer surplus before the quota?
e. What is the amount of consumer surplus after the quota?
f. What is the amount of producer surplus before the quota?
g. What is the amount of producer surplus after the quota?
h. What would be the amount of deadweight loss due to the quota?
Definitions:
Internal Data Sources
Sources of data that originate from within the organization, including sales records, customer databases, and financial documents.
Simple Random Sampling
A type of sampling in which everyone in the target population has an equal chance of being selected.
Internal Company Data
Information collected from within an organization, used for analysis, decision-making, and strategic planning.
Competitive Intelligence
The systematic gathering of data about strategies that direct and indirect competitors are pursuing in terms of new-product development and the marketing mix.
Q30: The deadweight loss of a tax is
Q32: Market failure with common resources occurs because:<br>A)
Q36: According to Graph 6-8, the amount of
Q38: Prices will always regulate consumption adequately because
Q47: The size and scope of technology spillovers
Q54: Trade among nations is ultimately based on
Q79: If the government allows landowners to kill
Q82: According to Graph 9-6, the price and
Q110: Welfare economics is the study of:<br>A) how
Q112: Supply and demand determine prices and prices