TABLE 2-16
The figure below is the percentage polygon for the amount of calories for a sample of 36 pizzas products where the upper limits of the intervals are: 310, 340, 370, 400 and 430.
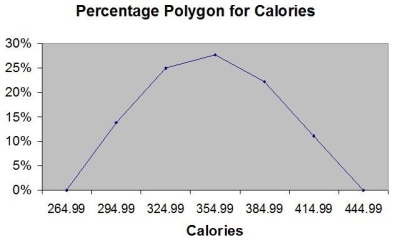
-Referring to Table 2-16, roughly what percentage of pizza products contains between 400 and 430 calories?
Definitions:
Sample Sizes
The number of units or observations included in a sample drawn from a population; crucial for estimating population parameters with a certain level of precision.
Binomial Populations
Populations where the outcomes for each member can be classified into one of two categories, often conceptualized as "success" or "failure."
Normal Distribution
A bell-shaped frequency distribution curve that is entirely defined by its mean and standard deviation.
Sample Sizes
Refers to the number of observations or data points collected in a subset of a population for the purpose of statistical analysis.
Q19: The family of a patient being treated
Q31: Referring to Table 4-2, the events "Did
Q77: Referring to Table 5-5, what is the
Q84: Referring to Table 3-4, the median of
Q95: Referring to Table 2-5, if 100 calls
Q106: In a set of numerical data, the
Q108: Simple probability is also called<br>A) marginal probability.<br>B)
Q118: Referring to Table 2-5, what is the
Q125: The coefficient of variation measures variability in
Q182: Referring to Table 2-6, of those who