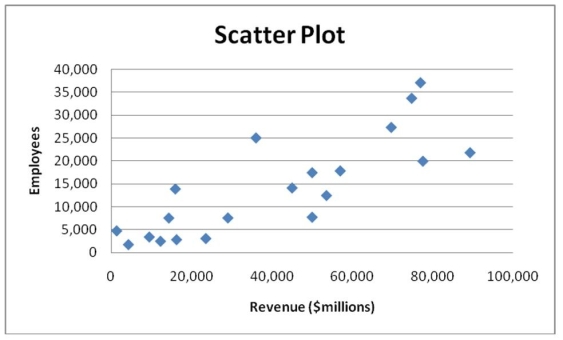
Given below is the scatter plot of the number of employees and the total revenue ($millions) of 20 U.S. companies. Companies that have higher numbers of employees appear to also have higher total revenue.
Definitions:
Mode
The value that occurs most frequently in a given set of data.
Distribution
In statistics, a mathematical representation of the observed or possible frequencies of occurrences of a range of outcomes.
Normally Distributed
A statistical term describing data that fall into a symmetrical, bell-shaped curve where most observations cluster around the mean.
Standard Deviation
An analytical tool that assesses the level of diversity or deviation of data points from their central value.
Q10: The nurse points out that negative symptoms
Q28: The home health nurse counseling a family
Q39: Referring to Table 3-4, the range of
Q66: According to a survey of American households,
Q86: The Dean of Students conducted a survey
Q107: Referring to Table 5-4, the variance of
Q129: Referring to Table 3-1, determine the median
Q146: Referring to Table 3-4, the arithmetic mean
Q158: Referring to Table 2-12, _ percent of
Q218: Referring to Table 5-7, if your investment