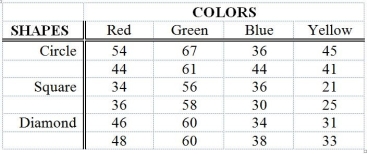
TABLE 11-12
The marketing manager of a company producing a new cereal aimed for children wants to examine the effect of the color and shape of the box's logo on the approval rating of the cereal. He combined 4 colors and 3 shapes to produce a total of 12 designs. Each logo was presented to 2 different groups (a total of 24 groups) and the approval rating for each was recorded and is shown below. The manager analyzed these data using the α = 0.05 level of significance for all inferences.

Analysis of Variance
Source df SS MS F p
Colors 3 2711.17 903.72 72.30 0.000
Shapes 2 579.00 289.50 23.16 0.000
Interaction 6 150.33 25.06 2.00 0.144
Error 12 150.00 12.50
Total 23 3590.50
-Referring to Table 11-12, the mean square for error is ________.
Definitions:
Units Sold
The total number of individual items that have been sold over a specified time period.
Manufacturing Costs
Expenses directly related to the production of goods, including materials, labor, and overhead costs.
Manufacturing Overhead
All indirect production costs associated with the manufacturing process, excluding direct materials and direct labor.
Cost Formula
An equation or method used to determine the total costs associated with production or service delivery, often incorporating both fixed and variable components.
Q13: In what type of test is the
Q53: Referring to Table 12-7, the decision made
Q109: The procedure for the Wilcoxon rank sum
Q110: Referring to Table 13-10, what is the
Q117: In instances in which there is insufficient
Q125: Referring to Table 12-2, the p-value of
Q133: Referring to Table 13-10, construct a 95%
Q187: Referring to Table 13-5, the coefficient of
Q190: Referring to Table 11-5, what is the
Q198: If you are comparing the mean sales