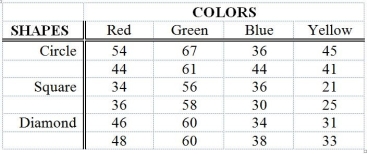
TABLE 11-12
The marketing manager of a company producing a new cereal aimed for children wants to examine the effect of the color and shape of the box's logo on the approval rating of the cereal. He combined 4 colors and 3 shapes to produce a total of 12 designs. Each logo was presented to 2 different groups (a total of 24 groups) and the approval rating for each was recorded and is shown below. The manager analyzed these data using the α = 0.05 level of significance for all inferences.

Analysis of Variance
Source df SS MS F p
Colors 3 2711.17 903.72 72.30 0.000
Shapes 2 579.00 289.50 23.16 0.000
Interaction 6 150.33 25.06 2.00 0.144
Error 12 150.00 12.50
Total 23 3590.50
-Referring to Table 11-12, the critical value of the test for significant differences between colors is ________.
Definitions:
Risk Reduction
Strategies or actions implemented to minimize the probability or impact of negative events or losses.
Market for Risk
A financial market where individuals and institutions trade financial instruments to manage risk exposure.
Risk Reduction
Strategies or actions taken to minimize the potential for loss or harm in investment, business operations, or other areas of concern.
Probability
The probability or possibility of a particular event happening.
Q20: Referring to Table 12-13, the critical value
Q21: Referring to Table 12-5, there is sufficient
Q42: Referring to Table 9-8, the null hypothesis
Q83: Referring to Table 9-3, the consumer group
Q90: Referring to Table 9-2, what would be
Q97: Referring to Table 12-18, what is your
Q108: Referring to Table 12-12, how many children
Q113: Referring to Table 12-13, the degrees of
Q139: In a two-way ANOVA, the degrees of
Q200: Referring to Table 13-4, the least squares