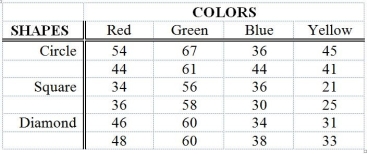
TABLE 11-12
The marketing manager of a company producing a new cereal aimed for children wants to examine the effect of the color and shape of the box's logo on the approval rating of the cereal. He combined 4 colors and 3 shapes to produce a total of 12 designs. Each logo was presented to 2 different groups (a total of 24 groups) and the approval rating for each was recorded and is shown below. The manager analyzed these data using the α = 0.05 level of significance for all inferences.

Analysis of Variance
Source df SS MS F p
Colors 3 2711.17 903.72 72.30 0.000
Shapes 2 579.00 289.50 23.16 0.000
Interaction 6 150.33 25.06 2.00 0.144
Error 12 150.00 12.50
Total 23 3590.50
-Referring to Table 11-12, the value of the statistic used to test for an interaction is ________.
Definitions:
Q19: Referring to Table 13-11, the null hypothesis
Q29: Referring to Table 11-2, the within group
Q66: A powerful women's group has claimed that
Q85: Referring to Table 9-7, the null hypothesis
Q88: Referring to Table 11-3, the sporting goods
Q122: Referring to Table 10-4, a two-tail test
Q143: Referring to Table 10-9, construct a 99%
Q146: Referring to Table 11-4, using an overall
Q207: Referring to Table 13-13, the error sum
Q254: Referring to Table 14-2, suppose an employee