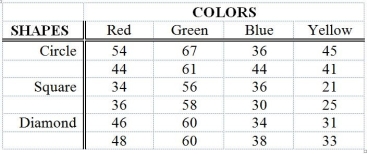
TABLE 11-12
The marketing manager of a company producing a new cereal aimed for children wants to examine the effect of the color and shape of the box's logo on the approval rating of the cereal. He combined 4 colors and 3 shapes to produce a total of 12 designs. Each logo was presented to 2 different groups (a total of 24 groups) and the approval rating for each was recorded and is shown below. The manager analyzed these data using the α = 0.05 level of significance for all inferences.

Analysis of Variance
Source df SS MS F p
Colors 3 2711.17 903.72 72.30 0.000
Shapes 2 579.00 289.50 23.16 0.000
Interaction 6 150.33 25.06 2.00 0.144
Error 12 150.00 12.50
Total 23 3590.50
-Referring to Table 11-12, based on the results of the hypothesis test, it appears that there is a significant interaction.
Definitions:
Average Price Level
The average price level refers to the general level of prices for goods and services in an economy over a given period, often used as an indicator of inflation.
Monetary Policy
The process by which the central bank or monetary authority of a country controls the supply of money, often targeting an inflation rate or interest rate to ensure economic stability and growth.
Federal Reserve
The central bank of the United States, responsible for monetary policy, regulating banks, maintaining financial stability, and providing financial services.
Reserve Ratio
The fraction of depositors' balances that banks must have on hand as cash, a regulation set by central banks to ensure liquidity.
Q17: Referring to Table 12-11, the same decision
Q24: If the sample sizes in each group
Q38: Referring to Table 13-12, there is sufficient
Q134: Referring to Table 13-1, interpret the estimate
Q135: Referring to Table 13-9, the error sum
Q138: Suppose there is interest in comparing the
Q158: Referring to Table 13-10, what is the
Q163: Referring to Table 11-3, in testing the
Q188: A Marine drill instructor recorded the time
Q212: Referring to Table 11-7, the randomized block