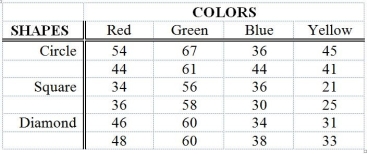
TABLE 11-12
The marketing manager of a company producing a new cereal aimed for children wants to examine the effect of the color and shape of the box's logo on the approval rating of the cereal. He combined 4 colors and 3 shapes to produce a total of 12 designs. Each logo was presented to 2 different groups (a total of 24 groups) and the approval rating for each was recorded and is shown below. The manager analyzed these data using the α = 0.05 level of significance for all inferences.

Analysis of Variance
Source df SS MS F p
Colors 3 2711.17 903.72 72.30 0.000
Shapes 2 579.00 289.50 23.16 0.000
Interaction 6 150.33 25.06 2.00 0.144
Error 12 150.00 12.50
Total 23 3590.50
-Referring to Table 11-12, the value of the statistic used to test for an interaction is ________.
Definitions:
Value-Expressive Influence
The effect on consumer behavior driven by the desire to express one's self-concept through the use of products or brands.
Referential Influence
The impact that the opinion of others has on an individual's choice or behavior, typically within a social context.
Informational Influence
The effect that the knowledge, opinions, or behaviors of others can have on one’s own responses, often leading to conformity due to the desire to be correct.
Expert Power
Expert Power is the ability to influence others' attitudes or behaviors based on the perception of one's knowledge, expertise, or experience in a specific area.
Q14: When the F test is used for
Q33: Referring to Table 13-3, suppose the director
Q44: Referring to Table 12-7, what are the
Q49: Referring to Table 12-8, the calculated test
Q140: Referring to Table 11-8, the among-group variation
Q143: Referring to Table 11-8, what is the
Q144: Referring to Table 12-18, what is the
Q152: Regression analysis is used for prediction, while
Q154: Referring to Table 12-5, the null hypothesis
Q159: Referring to Table 11-5, what are the