TABLE 13-2
A candy bar manufacturer is interested in trying to estimate how sales are influenced by the price of their product. To do this, the company randomly chooses 6 small cities and offers the candy bar at different prices. Using candy bar sales as the dependent variable, the company will conduct a simple linear regression on the data below: 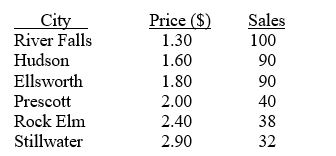
-Referring to Table 13-2, what is the percentage of the total variation in candy bar sales explained by the regression model?
Definitions:
Peak
The highest point or maximum value of a graph, often used in reference to spectra in analytical chemistry indicating a specific property.
C=C Stretching Frequency
Refers to the frequency at which the carbon-carbon double bonds in a molecule vibrate, typically observed in infrared spectroscopy.
IR Absorption
The absorption of infrared radiation by molecules, leading to changes in vibrational energy levels, used in spectroscopy to identify functional groups.
Intense IR Absorption
A characteristic of some materials to strongly absorb infrared radiation at specific wavelengths, indicative of particular molecular bonds.
Q22: Referring to Table 14-15, you can conclude
Q24: Referring to Table 11-3, using an overall
Q24: In a multiple regression problem involving two
Q30: Referring to Table 13-4, the standard error
Q87: You give a pre-employment examination to your
Q112: Referring to Table 11-2, what should be
Q137: Referring to Table 14-15, you can conclude
Q148: Referring to Table 13-10, construct a 95%
Q175: The least squares method minimizes which of
Q187: Referring to Table 14-5, at the 0.01