TABLE 13-8
It is believed that GPA (grade point average, based on a four point scale) should have a positive linear relationship with ACT scores. Given below is the Excel output for predicting GPA using ACT scores based a data set of 8 randomly chosen students from a Big-Ten university.
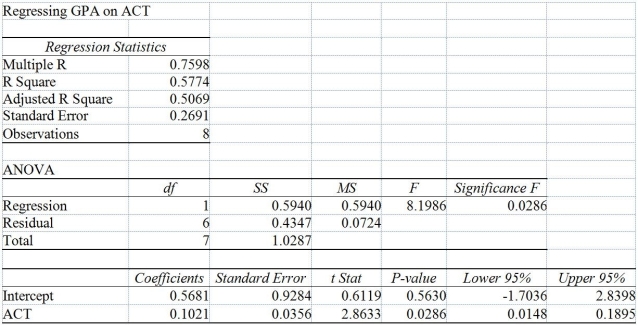
-Referring to Table 13-8, the value of the measured test statistic to test whether there is any linear relationship between GPA and ACT is
Definitions:
Q24: Referring to Table 13-11, which of the
Q39: If the sample sizes in each group
Q44: Referring to Table 13-3, suppose the director
Q114: Referring to Table 13-10, the value of
Q153: Referring to Table 14-17 Model 1, there
Q169: Referring to Table 14-13, the fitted model
Q177: The residuals represent<br>A) the difference between the
Q181: Referring to Table 13-10, the residual plot
Q264: The coefficient of multiple determination r²Y.₁₂ measures
Q337: Referring to Table 14-2, for these data,