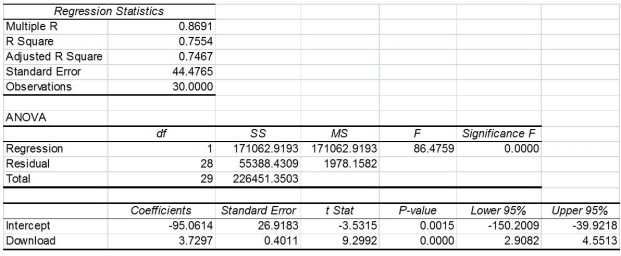
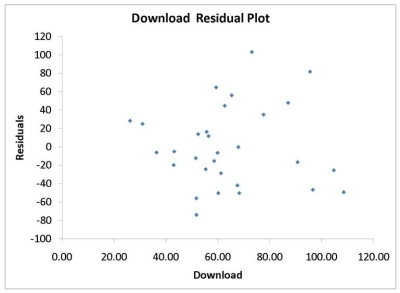
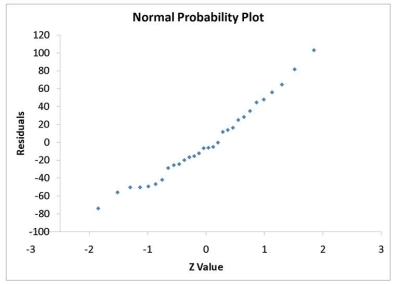
TABLE 13-11
A computer software developer would like to use the number of downloads (in thousands) for the trial version of his new shareware to predict the amount of revenue (in thousands of dollars) he can make on the full version of the new shareware. Following is the output from a simple linear regression along with the residual plot and normal probability plot obtained from a data set of 30 different sharewares that he has developed:


-Referring to Table 13-11, which of the following is the correct interpretation for the coefficient of determination?
Definitions:
Social Learning
The process of acquiring behaviors, skills, attitudes, or values from observing the actions or outcomes of others.
Psychoanalytic
Relating to or denoting a method of psychological therapy originated by Sigmund Freud which emphasizes unconscious mental processes.
Ethological
Pertaining to ethology, the scientific study of animal behavior under natural conditions.
Biological
Pertaining to the science of living organisms and life processes.
Q2: Referring to Table 11-8, the decision made
Q31: Referring to Table 15-4, there is reason
Q60: A multiple regression is called "multiple" because
Q89: An independent variable Xⱼ is considered highly
Q137: Referring to Table 13-10, what is the
Q148: Referring to Table 13-10, construct a 95%
Q151: Referring to Table 13-11, what are the
Q171: When the parametric assumption on the distribution
Q181: Referring to Table 14-7, the predicted GPA
Q296: Referring to Table 14-5, what is the