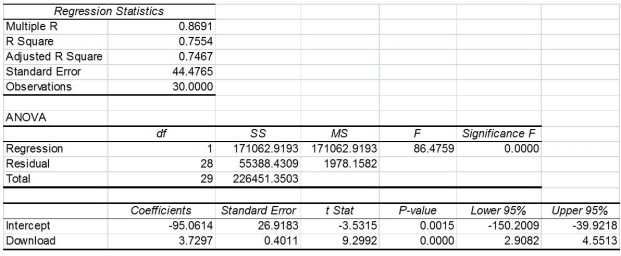
TABLE 13-11
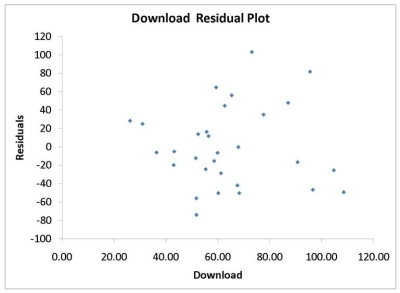
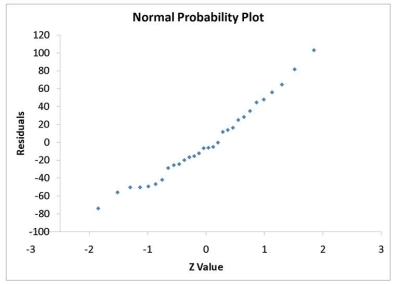
A computer software developer would like to use the number of downloads (in thousands) for the trial version of his new shareware to predict the amount of revenue (in thousands of dollars) he can make on the full version of the new shareware. Following is the output from a simple linear regression along with the residual plot and normal probability plot obtained from a data set of 30 different sharewares that he has developed:


-Referring to Table 13-11, there appears to be autocorrelation in the residuals.
Definitions:
Categorical Data
Data that can be separated into specific categories according to distinct characteristics that are non-numeric.
Geographical Areas
Refers to specific physical locations defined by natural or artificial boundaries.
Quantitative Data
Numerical data representing the quantity, amount, or range of something.
Data Dashboard
A set of visual displays that organizes and presents information that is used to monitor the performance of a company or organization in a manner that is easy to read, understand, and interpret.
Q7: Referring to Table 11-8, the decision made
Q14: Referring to 14-16, the 0 to 60
Q35: Referring to Table 14-14, the fitted model
Q74: Referring to Table 14-17 Model 1, which
Q119: Referring to Table 13-12, the model appears
Q129: Referring to Table 14-3, one economy in
Q157: Referring to Table 12-15, which test should
Q168: Referring to Table 14-17 Model 1, _
Q194: If the assumptions of the one-way ANOVA
Q313: Referring to Table 14-17 Model 1, what