TABLE 14-6
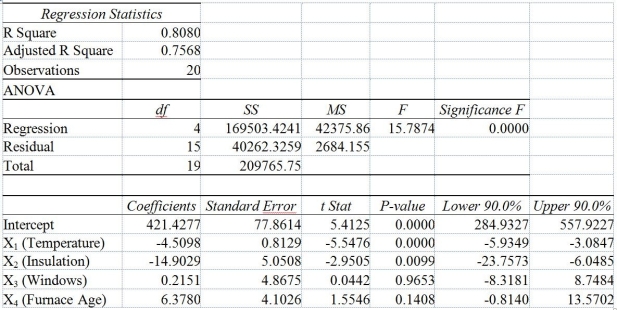
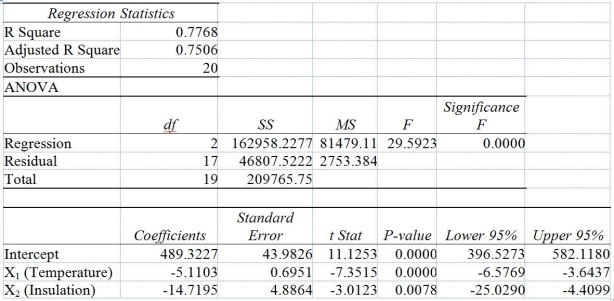
One of the most common questions of prospective house buyers pertains to the cost of heating in dollars (Y) . To provide its customers with information on that matter, a large real estate firm used the following 4 variables to predict heating costs: the daily minimum outside temperature in degrees of Fahrenheit (X₁) the amount of insulation in inches (X₂) , the number of windows in the house (X₃) , and the age of the furnace in years (X₄) . Given below are the Excel outputs of two regression models.
Model 1
Model 2
-Referring to Table 14-6, the estimated value of the partial regression parameter β₁ in Model 1 means that
Definitions:
Piaget's Theory
A comprehensive theory of cognitive development proposed by Jean Piaget, which outlines how children progress through distinct stages of intellectual growth.
Intellectual Development
The growth and change in an individual’s cognitive abilities and capacities throughout the lifespan, including thinking, problem-solving, and decision-making skills.
Understandings
The comprehension or grasp of knowledge about a particular subject, issue, or situation.
Discriminate
The act of making distinctions between people or things based on class, race, gender, etc., often leading to unfair treatment.
Q12: Referring to Table 12-2, the null hypothesis
Q39: If the sample sizes in each group
Q42: The chi-square test of independence requires that
Q77: Referring to Table 14-7, the department head
Q81: If the plot of the residuals is
Q126: Referring to Table 13-4, suppose the managers
Q158: Referring to Table 16-5, the number of
Q159: Referring to Table 14-15, predict the percentage
Q164: Referring to Table 12-16, there is sufficient
Q251: Referring to Table 14-15, what is the