TABLE 14-6
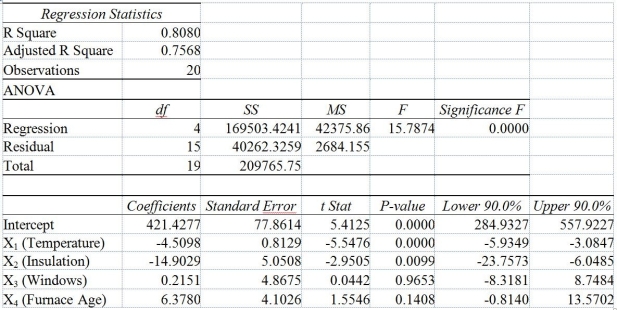
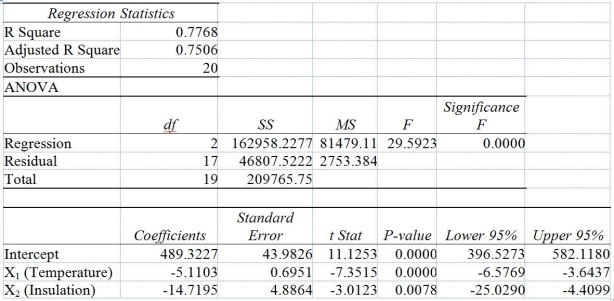
One of the most common questions of prospective house buyers pertains to the cost of heating in dollars (Y) . To provide its customers with information on that matter, a large real estate firm used the following 4 variables to predict heating costs: the daily minimum outside temperature in degrees of Fahrenheit (X₁) the amount of insulation in inches (X₂) , the number of windows in the house (X₃) , and the age of the furnace in years (X₄) . Given below are the Excel outputs of two regression models.
Model 1
Model 2
-Referring to Table 14-6, what can we say about Model 1?
Definitions:
Standard Normal Distribution
A probability distribution that has a mean of zero and a standard deviation of one, commonly represented in statistics.
Less Than
A mathematical comparison indicating that one value is smaller than another.
Z-scores
Scores that are normalized to show the number of standard deviations a data point is away from the average.
Standard Normal Distribution
A Gaussian distribution where the mean is zero and the standard deviation is one.
Q44: After estimating a trend model for annual
Q63: Referring to Table 14-7, the department head
Q87: Referring to Table 14-19, there is not
Q90: Referring to Table 13-2, to test whether
Q100: Referring to Table 13-12, what are the
Q112: Each forecast using the method of exponential
Q118: Referring to Table 13-13, what is the
Q134: Referring to Table 13-1, interpret the estimate
Q190: Referring to Table 14-17 Model 1, estimate
Q199: Referring to Table 14-15, you can conclude