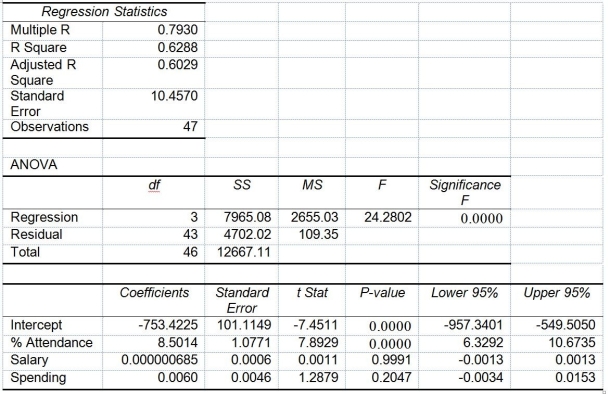
TABLE 14-15
The superintendent of a school district wanted to predict the percentage of students passing a sixth-grade proficiency test. She obtained the data on percentage of students passing the proficiency test (% Passing), daily mean of the percentage of students attending class (% Attendance), mean teacher salary in dollars (Salaries), and instructional spending per pupil in dollars (Spending) of 47 schools in the state.
Following is the multiple regression output with Y = % Passing as the dependent variable, X₁ = % Attendance, X₂= Salaries and X₃= Spending:

-Referring to Table 14-15, what is the standard error of estimate?
Definitions:
Centered
In statistics, adjusting data values by subtracting the mean of the data set from each value to have an average of zero.
Perfect Substitute
Goods or services that can be used in exactly the same way and are considered interchangeable by the consumer.
Indifference Curve
A graph representing combinations of two goods that provide an individual with the same level of satisfaction and utility.
Convex Preferences
A situation in consumer theory where a consumer prefers combinations or mixtures of goods to extreme amounts of either good, illustrating a desire for diversified consumption.
Q13: Referring to Table 13-4, the standard error
Q42: Referring to 14-16, there is enough evidence
Q60: A multiple regression is called "multiple" because
Q70: Referring to Table 12-16, the decision is
Q72: Referring to Table 14-4, one individual in
Q76: Referring to Table 16-12, using the regression
Q90: Referring to Table 15-3, suppose the chemist
Q91: Referring to Table 12-16, which is the
Q137: Referring to Table 13-10, what is the
Q200: Referring to Table 14-17 Model 1, what