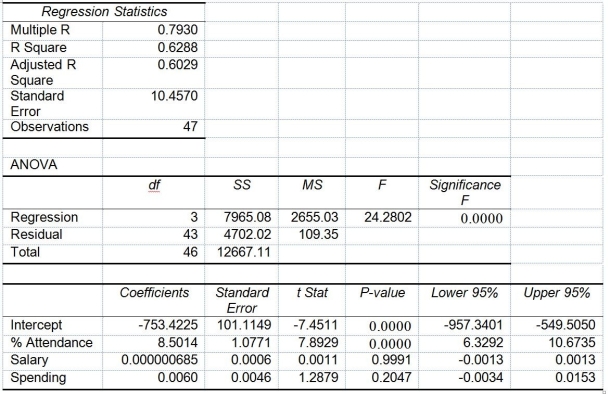
TABLE 14-15
The superintendent of a school district wanted to predict the percentage of students passing a sixth-grade proficiency test. She obtained the data on percentage of students passing the proficiency test (% Passing), daily mean of the percentage of students attending class (% Attendance), mean teacher salary in dollars (Salaries), and instructional spending per pupil in dollars (Spending) of 47 schools in the state.
Following is the multiple regression output with Y = % Passing as the dependent variable, X₁ = % Attendance, X₂= Salaries and X₃= Spending:

-Referring to Table 14-15, what is the value of the test statistic when testing whether daily mean of the percentage of students attending class has any effect on percentage of students passing the proficiency test, taking into account the effect of all the other independent variables?
Definitions:
Supplies Expense
Costs incurred for supplies used in the operations of a business.
Adjustment Data
Information used to make changes to accounts for the purposes of accurate financial reporting, such as accruals or deferrals.
Unbilled Consulting Revenue
Revenue earned from consulting services that have been delivered but not yet invoiced to the client.
Depreciation
The allocation of the cost of a tangible asset over its useful life, reflecting its loss of value over time.
Q14: Referring to Table 13-12, the value of
Q24: Referring to Table 17-5, the best estimate
Q51: Referring to Table 13-13, the regression mean
Q58: Referring to Table 16-9 and using a
Q87: Referring to Table 15-3, the prediction of
Q141: Referring to Table 13-10, the p-value of
Q183: Referring to Table 13-12, the estimated mean
Q314: Referring to Table 14-5, one company in
Q335: Referring to Table 14-18, which of the
Q352: Referring to Table 14-3, the p-value for