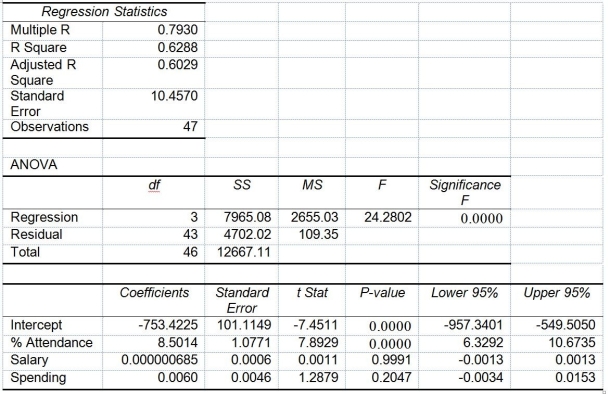
TABLE 14-15
The superintendent of a school district wanted to predict the percentage of students passing a sixth-grade proficiency test. She obtained the data on percentage of students passing the proficiency test (% Passing), daily mean of the percentage of students attending class (% Attendance), mean teacher salary in dollars (Salaries), and instructional spending per pupil in dollars (Spending) of 47 schools in the state.
Following is the multiple regression output with Y = % Passing as the dependent variable, X₁ = % Attendance, X₂= Salaries and X₃= Spending:

-Referring to Table 14-15, what is the p-value of the test statistic when testing whether daily average of the percentage of students attending class has any effect on percentage of students passing the proficiency test, taking into account the effect of all the other independent variables?
Definitions:
Decision
The choice made between two or more alternatives, often in a business or strategic context, that affects the course of action.
Relevant
Pertaining to information or factors that are applicable and significant to a specific decision or situation.
Alternatives
Different options or strategies considered in decision-making processes or problem-solving situations.
Sunk Costs
Costs that have already been incurred and cannot be recovered, and therefore should not factor into future decisions.
Q6: Referring to Table 17-7, an R chart
Q8: As a project for his business statistics
Q47: In trying to construct a model to
Q71: Referring to Table 13-3, the director of
Q91: Referring to Table 16-7, the fitted trend
Q124: Referring to Table 14-17 Model 1 Model
Q139: A first-order autoregressive model for stock sales
Q189: Referring to Table 14-14, the predicted mileage
Q199: Referring to Table 13-11, what is the
Q252: Referring to Table 14-15, what are the