TABLE 14-16
What are the factors that determine the acceleration time (in sec.) from 0 to 60 miles per hour of a car? Data on the following variables for 171 different vehicle models were collected:
Accel Time: Acceleration time in sec.
Cargo Vol: Cargo volume in cu. ft.
HP: Horsepower
MPG: Miles per gallon
SUV: 1 if the vehicle model is an SUV with Coupe as the base when SUV and Sedan are both 0
Sedan: 1 if the vehicle model is a sedan with Coupe as the base when SUV and Sedan are both 0
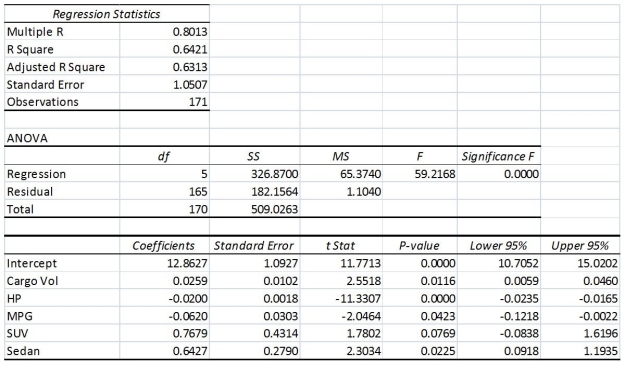
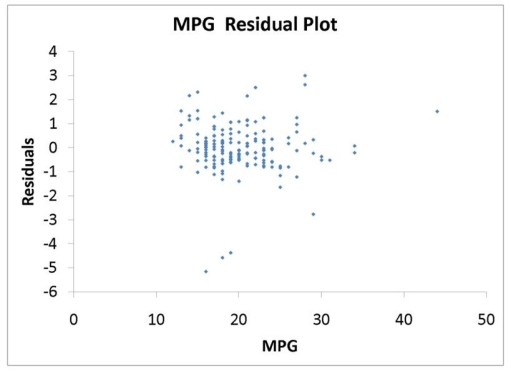
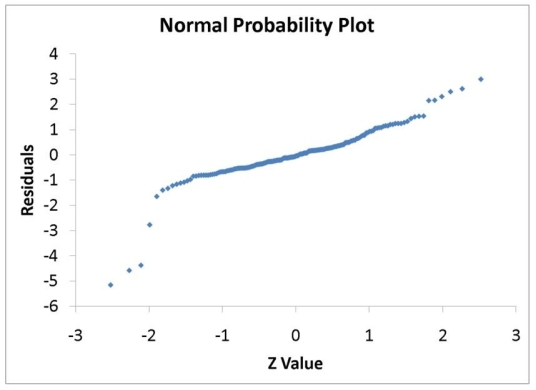
The regression results using acceleration time as the dependent variable and the remaining variables as the independent variables are presented below.
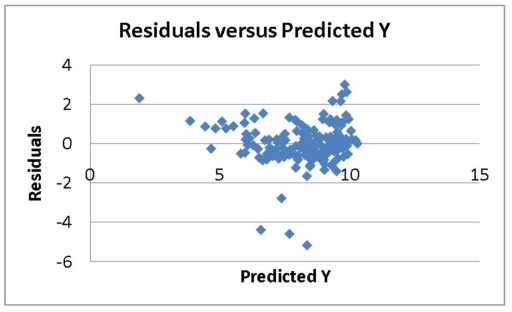
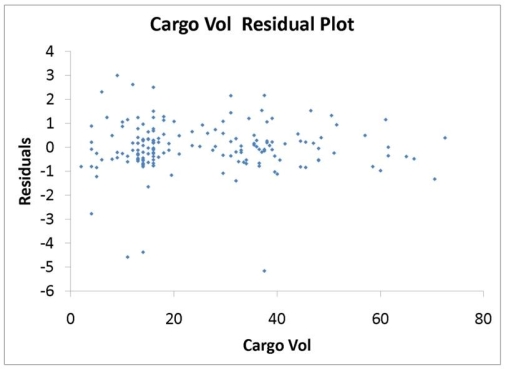
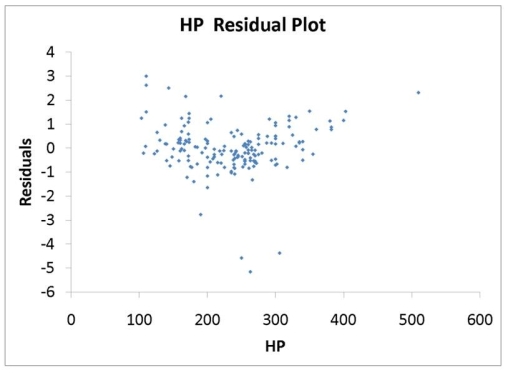
The various residual plots are as shown below.
-Referring to 14-16, what is the p-value of the test statistic to determine whether HP makes a significant contribution to the regression model in the presence of the other independent variables at a 5% level of significance?
Definitions:
Horizontal Axis
The x-axis in a graph, generally representing the independent variable in data representation or analysis.
Perfect Complements
Goods that are consumed together in fixed proportions because their use together enhances their combined utility.
Indifference Curves
Graphical representations used in microeconomics to show different combinations of two goods between which a consumer is indifferent, signifying equal levels of utility.
Bliss Point
The optimal quantity of consumption where any further increase or decrease would lead to lower satisfaction or utility.
Q91: Referring to Table 12-16, which is the
Q97: The effect of an unpredictable, rare event
Q107: Referring to Table 13-3, the coefficient of
Q126: Referring to Table 12-20, what should be
Q134: Referring to Table 13-1, interpret the estimate
Q184: Referring to Table 13-9, the p-value of
Q226: Referring to Table 14-17 Model 1, _
Q241: Referring to Table 14-19, which of the
Q320: Referring to Table 14-17 Model 1, what
Q337: Referring to Table 14-2, for these data,