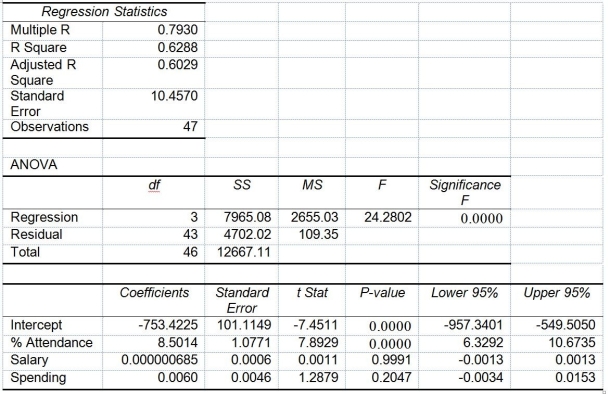
TABLE 14-15
The superintendent of a school district wanted to predict the percentage of students passing a sixth-grade proficiency test. She obtained the data on percentage of students passing the proficiency test (% Passing), daily mean of the percentage of students attending class (% Attendance), mean teacher salary in dollars (Salaries), and instructional spending per pupil in dollars (Spending) of 47 schools in the state.
Following is the multiple regression output with Y = % Passing as the dependent variable, X₁ = % Attendance, X₂= Salaries and X₃= Spending:

-Referring to Table 14-15, estimate the mean percentage of students passing the proficiency test for all the schools that have a daily mean of 95% of students attending class, an mean teacher salary of 40,000 dollars, and an instructional spending per pupil of 2,000 dollars.
Definitions:
Q2: Referring to Table 14-7, the department head
Q8: Referring to Table 17-5, a p control
Q10: Referring to Table 12-15, what should be
Q39: Referring to Table 16-5, exponentially smooth the
Q48: Referring to Table 15-3, suppose the chemist
Q64: Referring to Table 13-3, suppose the director
Q73: Referring to Table 12-20, what should be
Q121: Referring to Table 17-4, suppose the supervisor
Q139: Referring to Table 12-19, the calculated value
Q289: Referring to Table 14-6, what are the