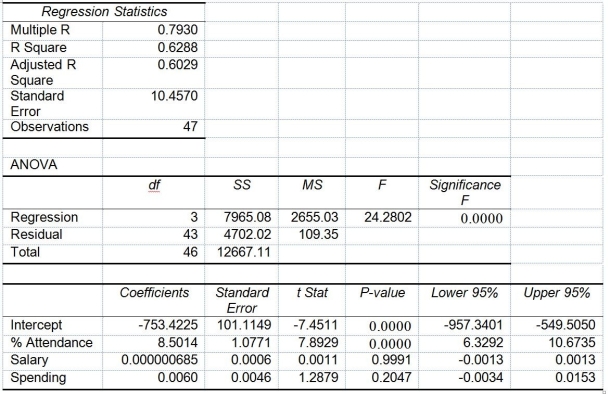
TABLE 14-15
The superintendent of a school district wanted to predict the percentage of students passing a sixth-grade proficiency test. She obtained the data on percentage of students passing the proficiency test (% Passing), daily mean of the percentage of students attending class (% Attendance), mean teacher salary in dollars (Salaries), and instructional spending per pupil in dollars (Spending) of 47 schools in the state.
Following is the multiple regression output with Y = % Passing as the dependent variable, X₁ = % Attendance, X₂= Salaries and X₃= Spending:

-Referring to Table 14-15, the null hypothesis H₀: = β₁ = β₂ = β₃ = 0 implies that percentage of students passing the proficiency test is not related to one of the explanatory variables.
Definitions:
Return on Assets
A profitability ratio that measures how efficiently a company is using its assets to generate profit, calculated by dividing net income by total assets.
Shareholder Wealth
The total value of an investment in a company's stock, encompassing capital gains and dividends received over time.
Cash Flows
The comprehensive total of cash and similar to cash assets transferred into and from a business.
Payback Period
The duration needed to recoup the funds spent on an investment.
Q1: Referring to Table 16-4, a centered 3-year
Q65: Referring to Table 17-7, an <img src="https://d2lvgg3v3hfg70.cloudfront.net/TB1602/.jpg"
Q75: A second-order autoregressive model for average mortgage
Q99: Referring to Table 13-11, what is the
Q127: Assuming a linear relationship between X and
Q130: Referring to Table 13-3, the standard error
Q168: Referring to Table 12-17, the critical value
Q174: Referring to Table 14-5, suppose the microeconomist
Q269: Referring to 14-16, what is the correct
Q332: Referring to Table 14-17 and using both