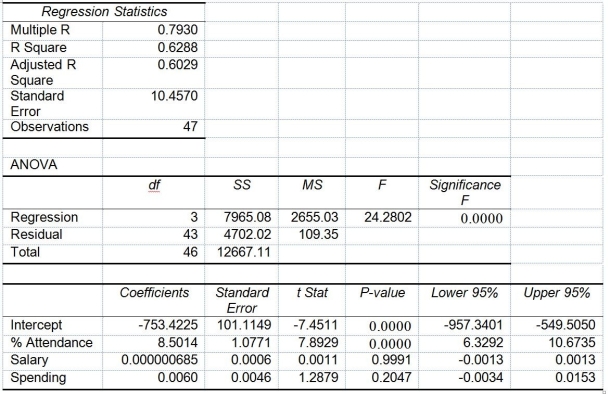
TABLE 14-15
The superintendent of a school district wanted to predict the percentage of students passing a sixth-grade proficiency test. She obtained the data on percentage of students passing the proficiency test (% Passing), daily mean of the percentage of students attending class (% Attendance), mean teacher salary in dollars (Salaries), and instructional spending per pupil in dollars (Spending) of 47 schools in the state.
Following is the multiple regression output with Y = % Passing as the dependent variable, X₁ = % Attendance, X₂= Salaries and X₃= Spending:

-Referring to Table 14-15, the alternative hypothesis H₁: At least one of βⱼ ≠ 0 for j = 1, 2, 3 implies that percentage of students passing the proficiency test is affected by at least one of the explanatory variables.
Definitions:
Belgium
A country located in Western Europe, known for its medieval towns, Renaissance architecture, and as headquarter of the European Union and NATO.
Disjoint
Referring to sets that have no elements in common; also used to describe events that cannot occur at the same time.
Proportion
The fraction of times an event occurs relative to the total number of trials or instances.
M&M Candy
A brand of colorful, button-shaped chocolates with a letter "m" printed on them, encased in a sugar shell.
Q12: Referring to Table 14-4, suppose the builder
Q29: Referring to Table 14-17 Model 1, there
Q38: Referring to Table 13-12, there is sufficient
Q68: Referring to Table 12-16, there is sufficient
Q89: An independent variable Xⱼ is considered highly
Q102: Referring to Table 16-10, the values of
Q110: The principle of parsimony indicates that the
Q159: Referring to Table 12-14, the director now
Q178: Referring to Table 13-8, the value of
Q179: Referring to Table 14-3, what is the