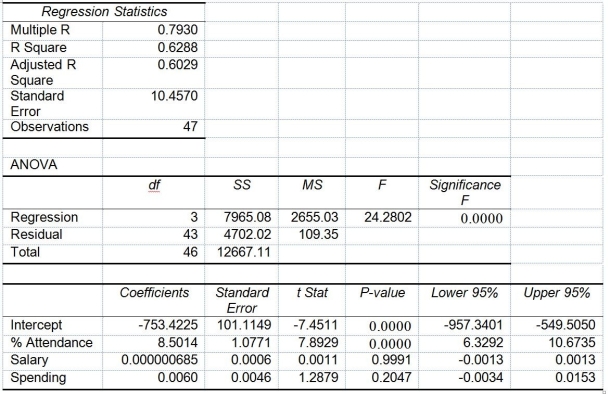
TABLE 14-15
The superintendent of a school district wanted to predict the percentage of students passing a sixth-grade proficiency test. She obtained the data on percentage of students passing the proficiency test (% Passing), daily mean of the percentage of students attending class (% Attendance), mean teacher salary in dollars (Salaries), and instructional spending per pupil in dollars (Spending) of 47 schools in the state.
Following is the multiple regression output with Y = % Passing as the dependent variable, X₁ = % Attendance, X₂= Salaries and X₃= Spending:

-Referring to Table 14-15, you can conclude that instructional spending per pupil individually has no impact on the mean percentage of students passing the proficiency test, taking into account the effect of all the other independent variables, at a 10% level of significance based solely on the 95% confidence interval estimate for β₃.
Definitions:
Population Proportion
The fraction or percentage of a population that exhibits a particular trait or characteristic.
Confidence Interval
A range of values, derived from sample statistics, that is likely to contain the value of an unknown population parameter at a given confidence level.
Population Proportion
The fraction of the population that possesses a particular attribute, characteristic, or trait.
Standard Normal Distribution
A probability distribution that has a mean of zero and a standard deviation of one, used in statistical analysis to represent standardized values of a dataset.
Q1: The Regression Sum of Squares (SSR) can
Q4: The coefficient of multiple determination is calculated
Q10: Which of the following is used to
Q15: Referring to Table 16-5, the number of
Q40: Referring to Table 15-2, given a quadratic
Q53: The Y-intercept (b₀) represents the<br>A) estimated average
Q59: The MAD is a measure of the
Q72: Referring to Table 16-4, exponential smoothing with
Q105: Referring to Table 16-13, what is your
Q130: Referring to Table 13-3, the standard error