TABLE 14-18
A logistic regression model was estimated in order to predict the probability that a randomly chosen university or college would be a private university using information on mean total Scholastic Aptitude Test score (SAT) at the university or college, the room and board expense measured in thousands of dollars (Room/Brd) , and whether the TOEFL criterion is at least 550 (Toefl550 = 1 if yes, 0 otherwise.) The dependent variable, Y, is school type (Type = 1 if private and 0 otherwise) .
The Minitab output is given below: 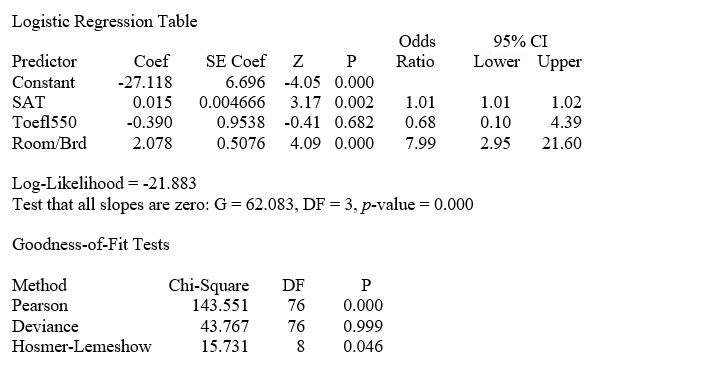
-Referring to Table 14-18, which of the following is the correct interpretation for the SAT slope coefficient?
Definitions:
Psychological Terms
A collective reference to the vocabulary and terminology used within the field of psychology.
Physical Terms
Specific words or phrases used to describe laws, principles, or phenomena in the physical sciences, such as physics or chemistry.
Social Comparisons
The process of assessing oneself against the standards, abilities, or conditions of others, which can influence self-esteem and aspirations.
Self-understanding
An individual's perception and assessment of their characteristics, emotions, and behaviors.
Q20: Every spring semester, the School of Business
Q34: Referring to Table 17-2, what is the
Q71: Referring to Table 15-6, the model that
Q76: Referring to Table 17-8, an <img src="https://d2lvgg3v3hfg70.cloudfront.net/TB1602/.jpg"
Q85: Referring to Table 13-4, set up a
Q89: Referring to Table 17-7, what percentage of
Q94: Referring to Table 14-10, the total degrees
Q98: The coefficient of multiple determination measures the
Q108: Referring to Table 17-4, suppose the supervisor
Q241: Referring to Table 14-19, which of the