TABLE 15-6
Given below are results from the regression analysis on 40 observations where the dependent variable is the number of weeks a worker is unemployed due to a layoff (Y) and the independent variables are the age of the worker (X₁), the number of years of education received (X₂), the number of years at the previous job (X₃), a dummy variable for marital status (X₄: 1 = married, 0 = otherwise), a dummy variable for head of household (X₅: 1 = yes, 0 = no) and a dummy variable for management position (X₆: 1 = yes, 0 = no).
The coefficient of multiple determination (R) for the regression model using each of the 6 variables Xⱼ as the dependent variable and all other X variables as independent variables are, respectively, 0.2628, 0.1240, 0.2404, 0.3510, 0.3342 and 0.0993.
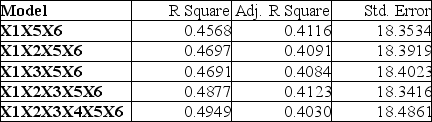
The partial results from best-subset regression are given below:
-Referring to Table 15-6, what is the value of the variance inflationary factor of Edu?
Definitions:
Utility Functions
Representations of the satisfaction or pleasure consumers derive from consuming various goods or services.
S-Shaped
Describes a curve or function that depicts an initial slow growth, followed by rapid acceleration, and then a plateau or leveling off, commonly found in logistic growth models.
Convex
A shape or function that curves outward or has a bulge, often used in economics and mathematics to describe certain types of optimization problems or preferences.
Confidence Index
A measure, often used in financial contexts, reflecting the confidence or optimism that investors have in the financial markets or in the economy as a whole.
Q5: Referring to Table 15-6, what is the
Q14: Referring to Table 16-13, you can reject
Q40: A political pollster randomly selects a sample
Q51: Referring to Table 15-1, a more parsimonious
Q67: Referring to Table 16-13, the best autoregressive
Q89: Referring to Table 17-7, what percentage of
Q95: Referring to 14-16, what is the value
Q108: Referring to Table 17-4, suppose the supervisor
Q120: Referring to Table 14-4, which of the
Q237: Referring to Table 14-11, in terms of