TABLE 15-6
Given below are results from the regression analysis on 40 observations where the dependent variable is the number of weeks a worker is unemployed due to a layoff (Y) and the independent variables are the age of the worker (X₁), the number of years of education received (X₂), the number of years at the previous job (X₃), a dummy variable for marital status (X₄: 1 = married, 0 = otherwise), a dummy variable for head of household (X₅: 1 = yes, 0 = no) and a dummy variable for management position (X₆: 1 = yes, 0 = no).
The coefficient of multiple determination (R) for the regression model using each of the 6 variables Xⱼ as the dependent variable and all other X variables as independent variables are, respectively, 0.2628, 0.1240, 0.2404, 0.3510, 0.3342 and 0.0993.
The partial results from best-subset regression are given below:
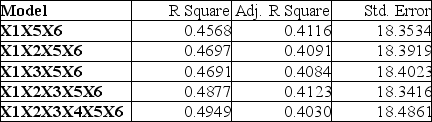
-Referring to Table 15-6, the model that includes all the six independent variables should be among the appropriate models using the Mallow's Cp statistic.
Definitions:
Lax Enforcement
Lax enforcement refers to a situation where rules, laws, or regulations are not strictly applied or are inadequately followed by authorities.
Organized Crime
A category of transnational, national, or local groupings of highly centralized enterprises run by criminals who intend to engage in illegal activity, most commonly for profit.
Jazz
A music genre originating in the African-American communities of New Orleans, USA, in the late 19th and early 20th centuries, known for its distinctive rhythm, improvisation, and use of brass and woodwind instruments.
Art Form
A medium through which artists express their emotions, thoughts, or ideas, including painting, sculpture, music, dance, and more.
Q10: Referring to Table 17-9, an <img src="https://d2lvgg3v3hfg70.cloudfront.net/TB1602/.jpg"
Q31: Referring to Table 16-13, what is the
Q46: Which of the following is a method
Q47: In trying to construct a model to
Q59: The MAD is a measure of the
Q62: Referring to Table 9-3, if you select
Q82: Referring to Table 15-3, suppose the chemist
Q140: Referring to Table 14-5, which of the
Q157: Referring to Table 13-13, the decision on
Q308: Referring to Table 14-17 Model 1, what