TABLE 16-13
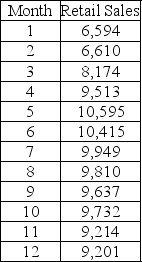
Given below is the monthly time-series data for U.S. retail sales of building materials over a specific year.

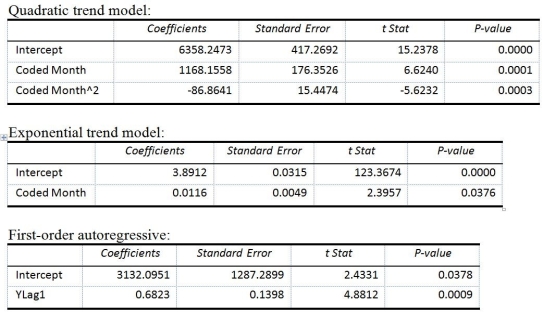
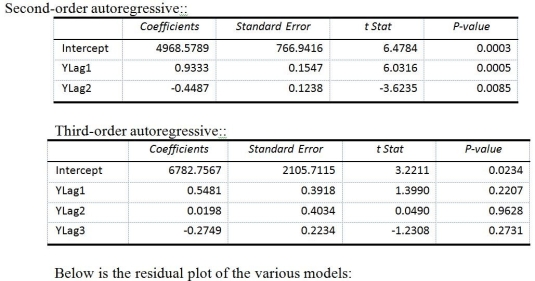
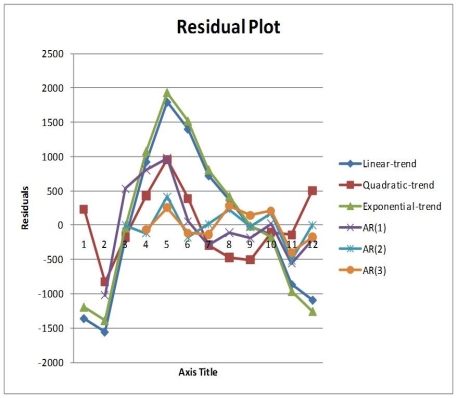
The results of the linear trend, quadratic trend, exponential trend, first-order autoregressive, second-order autoregressive and third-order autoregressive model are presented below in which the coded month for the first month is 0:


-Referring to Table 16-13, you can conclude that the second-order autoregressive model is appropriate at the 5% level of significance.
Definitions:
Q3: Referring to Table 17-8, construct an <img
Q5: Referring to Table 15-6, what is the
Q8: An insurance company evaluates many variables about
Q24: Referring to Table 17-5, the best estimate
Q30: Only when all three of the hat
Q59: The MAD is a measure of the
Q147: Referring to Table 7-1, 90% of all
Q158: Referring to Table 16-5, the number of
Q274: Referring to Table 19-5, what is the
Q300: Referring to Table 12-2, the decision made