TABLE 16-13
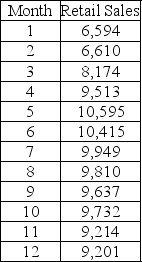
Given below is the monthly time-series data for U.S. retail sales of building materials over a specific year.

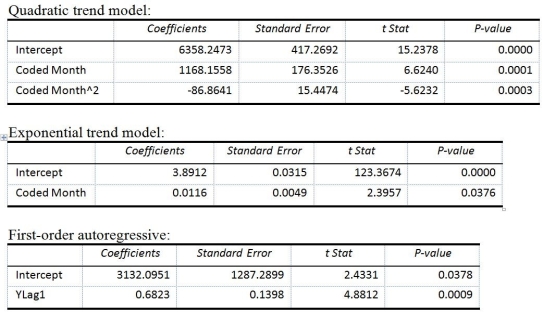
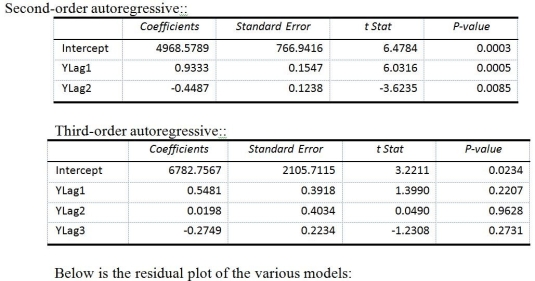
The results of the linear trend, quadratic trend, exponential trend, first-order autoregressive, second-order autoregressive and third-order autoregressive model are presented below in which the coded month for the first month is 0:


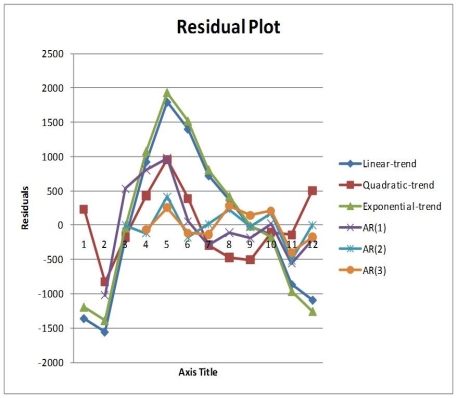
-Referring to Table 16-13, the best model based on the residual plots is the quadratic-trend regression model.
Definitions:
Aggressive Behavior
Actions intended to harm or cause discomfort to another person.
Control Group
In experimental research, the group of subjects that does not receive the experimental treatment, serving as a baseline for comparison.
Independent Variable
A variable in research that is manipulated or changed to observe its effect on a dependent variable.
Low-Fat Diet
A dietary approach that aims to reduce the intake of fatty foods, especially saturated fats and cholesterol, for health reasons.
Q3: Referring to Table 16-7, the forecast for
Q20: After estimating a trend model for annual
Q43: Referring to Table 14-17 and using both
Q43: Referring to Table 17-1, what is the
Q76: Referring to Table 16-12, using the regression
Q85: Referring to Table 15-6, what is the
Q115: Referring to Table 14-17 Model 1, the
Q135: Referring to Table 14-17 Model 1, there
Q216: Referring to 14-16, the 0 to 60
Q220: Referring to Table 16-1, what is the