Examlex

Solved

TABLE 16-13 Given Below Is the Monthly Time-Series Data for U.S. Retail

question 48

Short Answer

TABLE 16-13
Given below is the monthly time-series data for U.S. retail sales of building materials over a specific year.
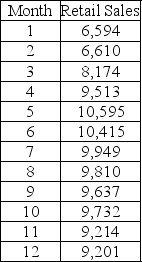
TABLE 16-13 Given below is the monthly time-series data for U.S. retail sales of building materials over a specific year.     The results of the linear trend, quadratic trend, exponential trend, first-order autoregressive, second-order autoregressive and third-order autoregressive model are presented below in which the coded month for the first month is 0:                -Referring to Table 16-13, what is your forecast for the 13ᵗʰ month using the third-order autoregressive model?
The results of the linear trend, quadratic trend, exponential trend, first-order autoregressive, second-order autoregressive and third-order autoregressive model are presented below in which the coded month for the first month is 0:
TABLE 16-13 Given below is the monthly time-series data for U.S. retail sales of building materials over a specific year.     The results of the linear trend, quadratic trend, exponential trend, first-order autoregressive, second-order autoregressive and third-order autoregressive model are presented below in which the coded month for the first month is 0:                -Referring to Table 16-13, what is your forecast for the 13ᵗʰ month using the third-order autoregressive model?
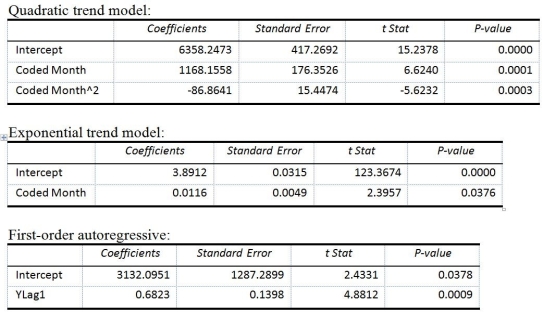
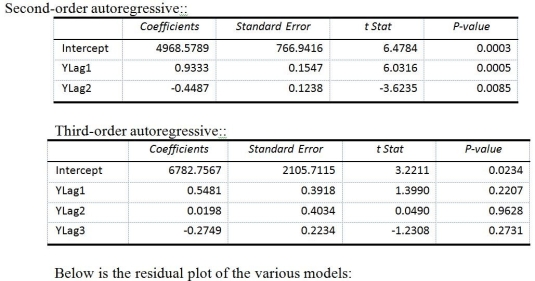
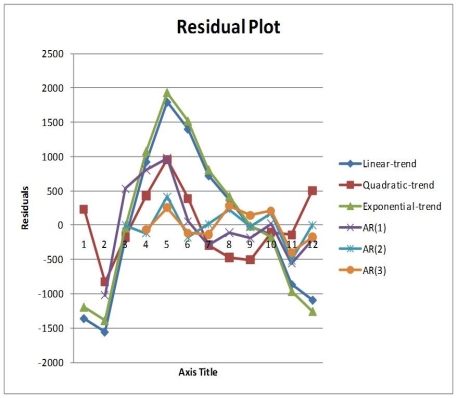
-Referring to Table 16-13, what is your forecast for the 13ᵗʰ month using the third-order autoregressive model?


Definitions:

Lower-Cost Method

A cost-minimization strategy that involves choosing the most economical options in order to reduce expenses and improve efficiency.

Process Innovation

The implementation of a new or significantly improved production or delivery method.

Total Product Curve

A graph showing the relationship between the quantity of input used and the quantity of output produced.

Marginal Cost Curve

A graphical representation showing how the cost of producing one additional unit of a good varies as the production volume changes.

Related Questions