TABLE 17-10
Below is the number of defective items from a production line over twenty consecutive morning shifts.
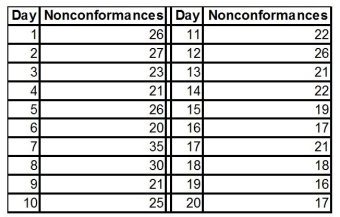
-Referring to Table 17-10, based on the c chart, there appears to be a special cause of variation in the process.
Definitions:
Absolute Measures
Statistical tools used to assess the total magnitude of an entity or phenomenon without comparison to other entities or phenomena.
Profitability
The financial metric that measures the degree to which a company or a project generates profit compared to its costs.
Standards
Established norms or criteria in various fields that define quality, performance, or procedures to ensure consistency and reliability.
Goodwill
An intangible asset that represents the value of a business's brand, customer relations, employee morale, and other factors not reflected in physical or financial assets.
Q55: The cause of variation that can be
Q80: A researcher is curious about the effect
Q85: Referring to Table 16-5, the number of
Q102: Referring to Table 16-1, what is the
Q123: Referring to Table 19-6, what is the
Q129: In a local cellular phone area, company
Q164: Referring to Table 16-7, the fitted exponential
Q166: Referring to Table 16-13, what is the
Q207: Referring to Table 19-1, if the probability
Q284: Referring to Table 14-19, what should be