True/False
(Figure: Sales and Advertising) The graph shows the advertising expenditures and the resulting sales (in bottles) of a new caffeinated beverage called Jump. The slope for the equation graphed is 3,000. 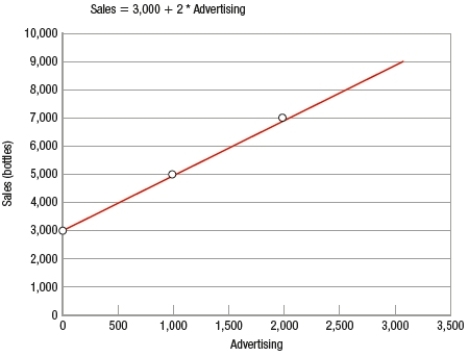
Understand the concept of the production possibilities frontier (PPF) and its assumptions.
Differentiate between attainable and unattainable points on the PPF.
Understand the implications of efficient resource use on the PPF.
Explain the concept of opportunity cost and its relationship to the PPF.
Definitions:
Related Questions
Q5: Who is currently able to use the
Q6: Which of the following statements is most
Q19: Scope may be divided into product scope
Q102: The private market for education can be
Q105: Which of these is NOT an example
Q209: Macroeconomics is concerned with issues such as<br>A)
Q224: Much of economic analysis is directed toward
Q254: (Figure: Sales and Advertising) The graph shows
Q307: Another definition of opportunity cost is the
Q319: There is general agreement as to which