The graph below shows the relationship between the distance traveled by a motorist and the time of travel. Find the slope of the line between the two points shown on the graph, namely (1, 80) and (3, 240) . Write a sentence that states the meaning of the slope. 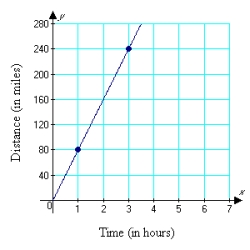
Definitions:
Q13: The length of a side of the
Q19: Graph the solution set of the inequality
Q21: Find the vertex and axis of symmetry,
Q21: Simplify: <img src="https://d2lvgg3v3hfg70.cloudfront.net/TB8311/.jpg" alt="Simplify: A)
Q28: Triangles ABC and DEF are similar with
Q34: Solve. <img src="https://d2lvgg3v3hfg70.cloudfront.net/TB8311/.jpg" alt="Solve. A)
Q46: Let <img src="https://d2lvgg3v3hfg70.cloudfront.net/TB8311/.jpg" alt="Let Find:
Q59: Factor by grouping: <img src="https://d2lvgg3v3hfg70.cloudfront.net/TB8311/.jpg" alt="Factor by
Q82: Solve: <img src="https://d2lvgg3v3hfg70.cloudfront.net/TB8311/.jpg" alt="Solve: A)
Q90: Given <img src="https://d2lvgg3v3hfg70.cloudfront.net/TB8311/.jpg" alt="Given ,