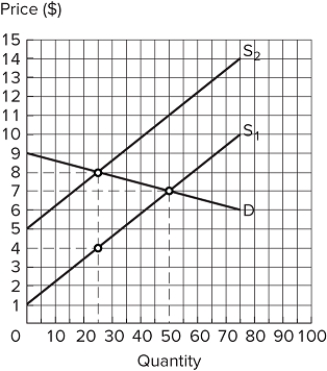
 Assume the market shown in the graph is in equilibrium at demand (D) and supply (S1) . If the supply curve shifts to S2, total surplus falls by:
Definitions:
Aggregate Supply
The total quantity of goods and services that producers in an economy are willing and able to supply at different price levels.
Rational Expectations
An economic theory that suggests individuals make decisions based on their best forecasts using all available information.
Sacrifice Ratio
The measure of the economic cost associated with reducing inflation, typically assessed in terms of the percentage loss in gross domestic product (GDP) for each percentage point decrease in inflation.
Anti-inflation Policy
A set of governmental or central bank strategies aimed at controlling or reducing the rate of inflation in the economy.
Q16: A market has four individuals, each considering
Q17: Using the annual price deflator information (https://fred.stlouisfed.org)
Q22: <img src="https://d2lvgg3v3hfg70.cloudfront.net/TB8194/.jpg" alt=" Consider the production
Q58: Mathematically, price elasticity of demand is the
Q59: Suppose an American worker can make 100
Q63: With the baby boomer generation hitting the
Q76: Suppose that a worker in Country A
Q108: The table shown displays CPI data for
Q123: Perfectly competitive markets are:<br>A) the most common
Q142: Junie is shopping for dinner. She notices